
JavaScript developers will spend most their time in the Chrome debugger, only to discover when they actually deploy to a mobile device their fancy mobile app hits all types of script errors. The problem is, you don’t have access to a console window on mobile browsers (out of the box) to see where the code failed. Let me introduce you to your new best friend JSConsole.
JSConsole is a webpage that hooks on to your remote mobile sessions and feeds back console logs into the webpage. It’s simple and works every time. To create the connection between your app and the jsConsole web viewer, you must first inject a line of code generated from the site. Lets walk through the steps.
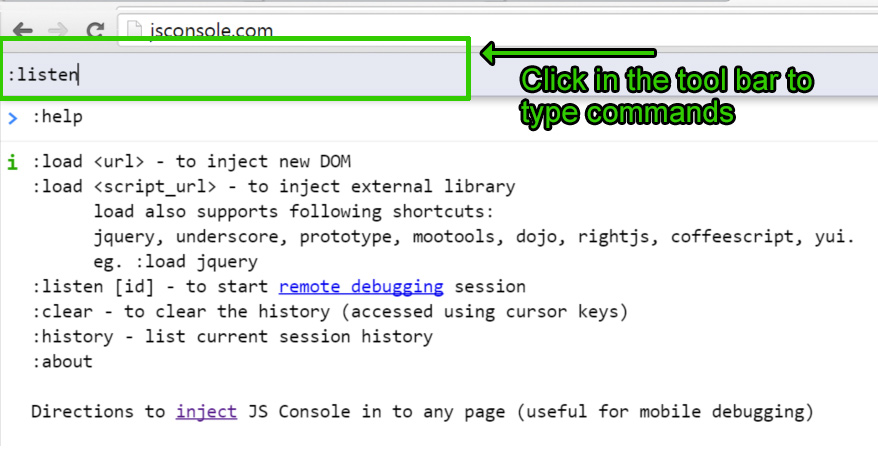
- load up the JSConsole console by going to www.jsconsole.com.
- You will see a list of commands and a hard to see input prompt. click the input bar and type in “:listen” as in the picture below. Don’t forget the colon or the command with fail.
3. After hitting enter, the console will create a connection and a script link with a unique identifier for connecting with your web app/website. Copy the link it creates.
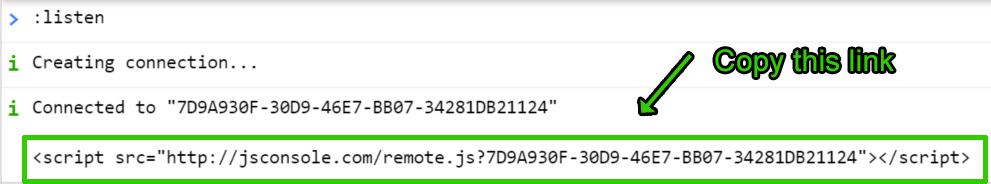
4. paste the link you copied into your html file, where ever you are importing your scripts, generally before the </body> tag.
<html>
    <body>

    <script>window.onload=function(){
    console.log("HELLO WORLD!")
    };
    </script>

    <script src="http://jsconsole.com/remote.js?7D9A930F-30D9-46E7-BB07-34281DB21124"></script>

    </body>
</html>
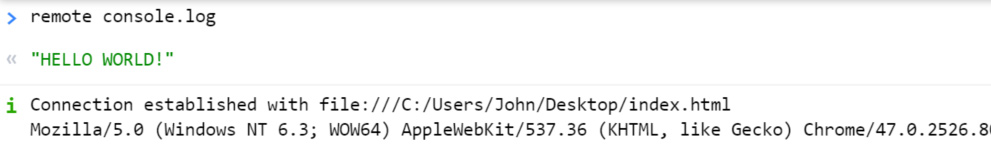
5.Refresh your web app page and take a look at the JSConsole window, you should now see remote logs feeding through!!
If you keep the jsconsole window open it should maintain the session connection. If you want to resume an old session, or jump to a different one, simply type :listen followed by your unique identifier into the jsconsole command prompt. Example. “:listen 7D9A930F-30D9-46E7-BB07-34281DB21124”.
IMPORTANT NOTE: Don’t forget to comment out your script injection before you go live!


Leave A Comment